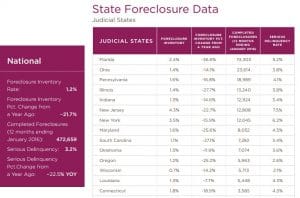
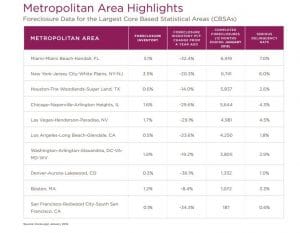
According to CoreLogic’s National Foreclosure Report New Jersey has a serious mortgage delinquency rate of 7.0% which is more than double the national average of 3.2%

New Jersey leads the nation with the highest foreclosure inventory as a percentage of mortgaged homes, as well as the highest rate of serious delinquency, according to the CoreLogic National Foreclosure report for January 2016.
“The improvement in distressed properties continues across the country in every state which is contributing to the lack of stock of available homes and resulting price escalation in many markets.
So far the trend toward lower delinquency and foreclosure has been immune from shocks from such things as the collapse of oil prices attesting to the durability of the housing recovery,” says Anand Nallathanmbi, President and CEO of CoreLogic. However, inventory tells only part of the story impacting homeowners.

January saw an atypical 6.6 percent rise in mortgage delinquencies from December, bringing the national delinquency rate above 5 percent for the first time since February 2015.
In the report, historical data indicates that delinquency rate increases are uncommon in the month of January having decreased over the past five years.
Prepayment activity plummeted in January to its lowest level since February 2014 as mortgage applications fell off in late December following the Federal Reserve’s announcement to raise interest rates.
Although January’s foreclosure sale volume was 4 percent below last year’s level, foreclosure sales have been trending upwards as a share of remaining 90+ day delinquent and foreclosure inventories.
Here are more highlights from the report:
Total U.S. loan delinquency rates (loans 30 or more days past due, but not in foreclosure) for January 2016 stands at 5.09%
Number of properties that are 30 or more days past due, but not in foreclosure: 2,575,000 up 167,00 month-over-month change and down 189,000 year-over-year change.
Number of properties that are 90 days or more past due, but not in foreclosure: 831,000 up 23,000 month-over-month change, and down 229,000 year-over-year change.
Number of properties in foreclosure pre-sale inventory 659,000 down 30,000 month-over-month change and down 226,000 year-over-year change.
Number of properties that are 30 or more days past due or in foreclosure 3,234,000 up 137,000 month-over-month change and down 415,000 year-over-year change.
